One Battery, Three Grid Bills: How Fingrid Proposes to Reprice Storage for 2029
13 August 2026 · 9 min read · Auranova Ventures
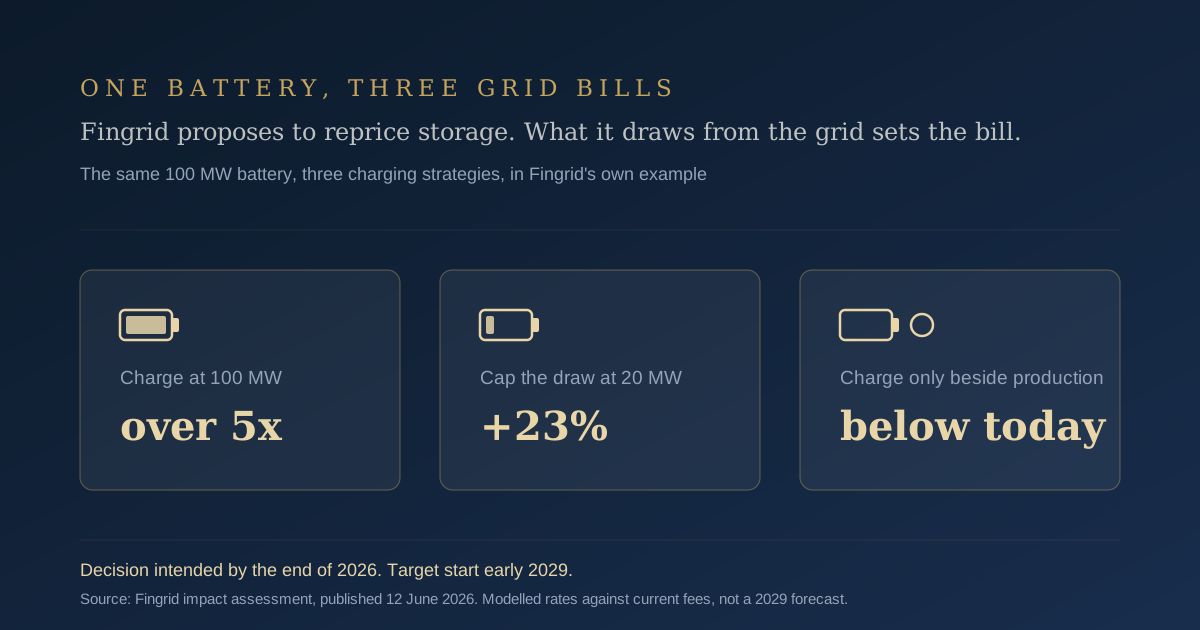
Take one 100 MW battery in Finland and run it three ways. Charge at full power and its transmission fees come out more than five times as high as today's. Cap the grid draw at 20 MW and the increase shrinks to 23 per cent. Never charge from the grid and it pays less than it does now. All three are Fingrid's own worked example of its proposed structure, modelled rates set against today's fees. The consultation closes 14 August and Fingrid intends to decide by year-end.
The development
On 12 June 2026 Fingrid, Finland's transmission system operator, published the impact assessment of its main grid tariff reform and opened a consultation that runs to 14 August. The main grid fee is the charge users of the high voltage grid pay Fingrid for transmission. Today it is almost entirely energy based: capacity fees carry about a tenth of the total in the report's reconstruction of 2024 billing; under the proposal they would carry 68 per cent on the same basis. The report itself flags one caveat: with only one main grid storage asset running through all of 2024, storage is assessed by separate calculation.
For storage the proposal has four moving parts. A consumption capacity fee on the highest hourly power drawn from the grid applies to consumption customers and to storage. A generation capacity fee continues on its current basis (short running power plants keep an energy fee alternative). A loss fee, priced equally in both directions, replaces today's per MWh input and output fees. A system fee covers reserves and stability costs. Storage gets two carve-outs: charge and discharge within the same 15 minutes cancel out before the loss fee is counted; the system fee applies only to the storage's loss energy, the share lost between charge and discharge.
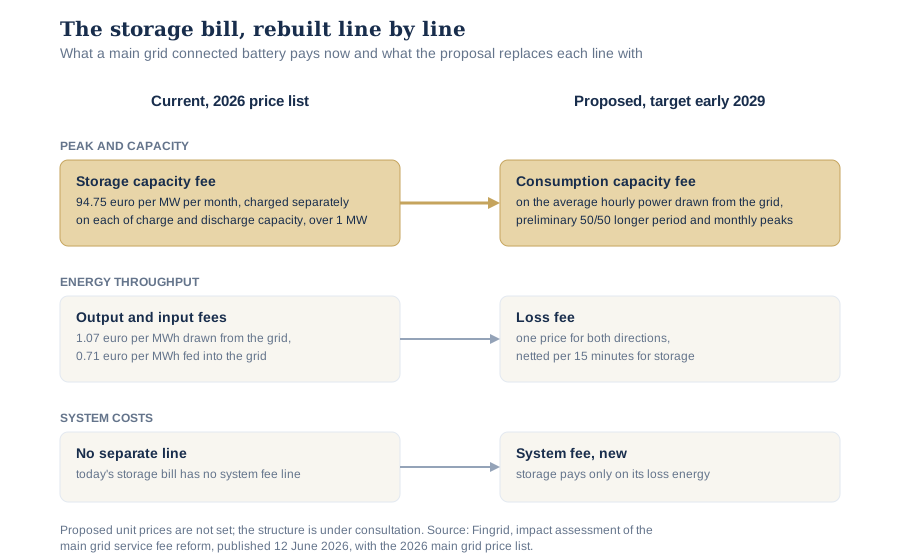
For batteries the decisive change is what disappears. Since the start of 2026 storage above 1 MW has paid a dedicated capacity fee of 94.75 euro per MW per month, half a power plant's rate, charged on both charging and discharging capacity. The reform abolishes it. In its place, storage pays the consumption capacity fee on its charging power, the same fee industry pays on its peak draw, metered as the average hourly power withdrawn from the grid. In the report's 2024 data illustration that fee prices at 1,340 euro per MW per month against 162 euro for generation capacity, roughly eight times as high. Those unit prices illustrate 2024 conditions, not 2029 levels, but the ratio is the message: grid draw becomes the expensive dimension of a battery.
The timeline is a stated intention, not a decided fact: a Fingrid decision intended by the end of 2026, then approval by the Energy Authority, Finland's energy regulator, then entry into force targeted for early 2029. One question is parked: Fingrid reports that the regulator's 26 June response read current law as allowing location based pricing in connection charges only, not in the main grid fee.
What it actually means
The proposal turns a forecast-and-forget line item into a function of three design choices.
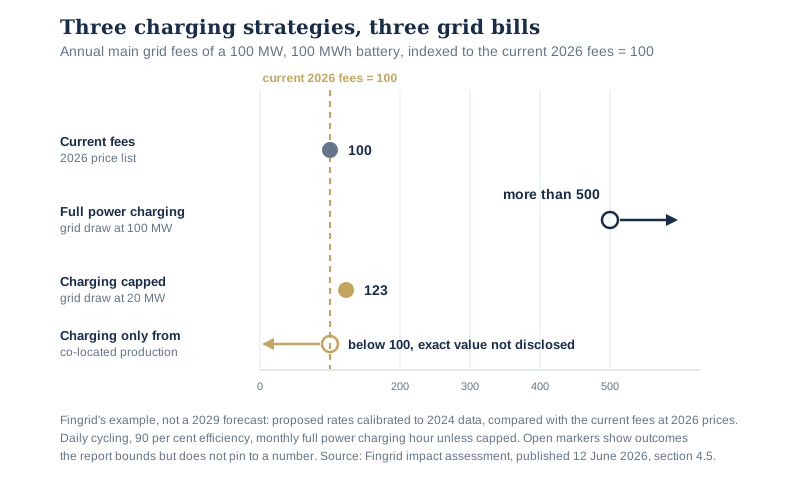
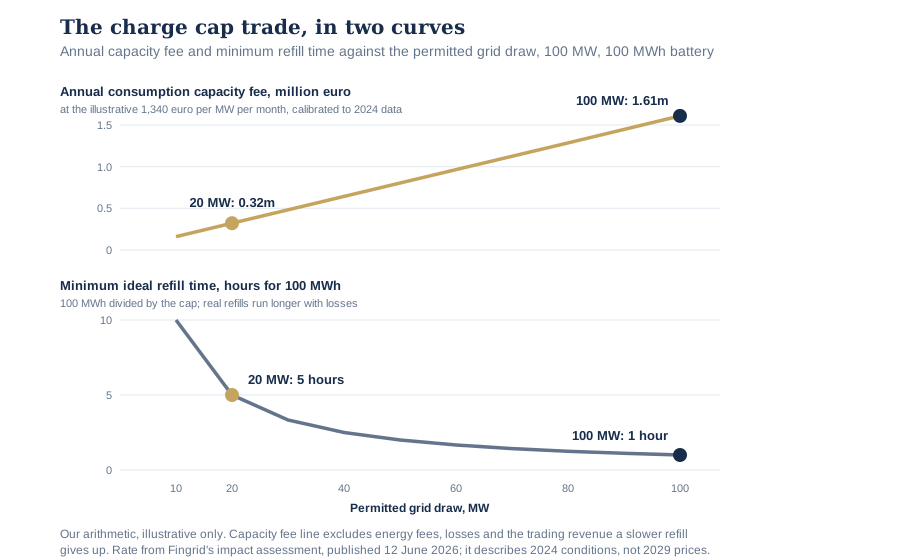
The first choice is the charge rate. The consumption capacity fee is assessed on hourly peaks, preliminarily weighted half on a longer period peak (previous year peak, rolling 12 months or contract power, still open) and half on the twelve measured monthly peaks together, so one full power charging hour sets that month's reading and can echo through the longer period measure. Capping the grid draw at 20 MW turns the example's more than fivefold increase into 23 per cent, per Fingrid's own calculation, while keeping full discharge capability, because the proposed capacity charge falls on what the battery draws from the grid, not on what it sends out.
The second choice is where the charging energy comes from. A battery in a hybrid connection, sharing a connection point with wind or solar, can schedule its charging against that production. In the report's case the battery takes no charging energy from the main grid at all and pays less than it does today, provided the production is actually there when the battery needs to fill. The report says plainly the fee is designed to push new storage toward production sites.
The third choice is the cycling profile, where the news is quietly good. A charge and discharge cycle costs 1.28 euro per MWh discharged under the modelled new structure against 1.62 euro under the fees it replaces, both at 90 per cent efficiency on 2024 unit prices. The reform moves most of the illustrated cost onto peak withdrawal rather than throughput. The exception is fast cycling: the loss and system fees would be measured per 15 minutes while the capacity fee stays on hourly peaks, so a battery that charges and discharges within the same hour loses the netting benefit today's hourly energy billing gives it.
For scale, our own arithmetic from the published rates: the example battery's current bill runs to roughly 0.3 million euro a year at the 2026 price list; more than five times that is above 1.5 million euro. These are static illustrations: no dynamic effects are modelled and by 2029 a larger fleet will share a different fee base, so the multiples bound the design problem rather than forecast a bill. Nor is the revenue side priced: a 20 MW cap stretches the refill from about one hour to five or more; those hours must all find cheap prices. When we at Auranova Ventures model a constraint like this, the deciding number is the fee saved net of the market revenue given up to earn it, never the fee alone. The tariff prices asymmetry into battery design; the net value calculation tells you how far to push it.
Who is affected and how differently
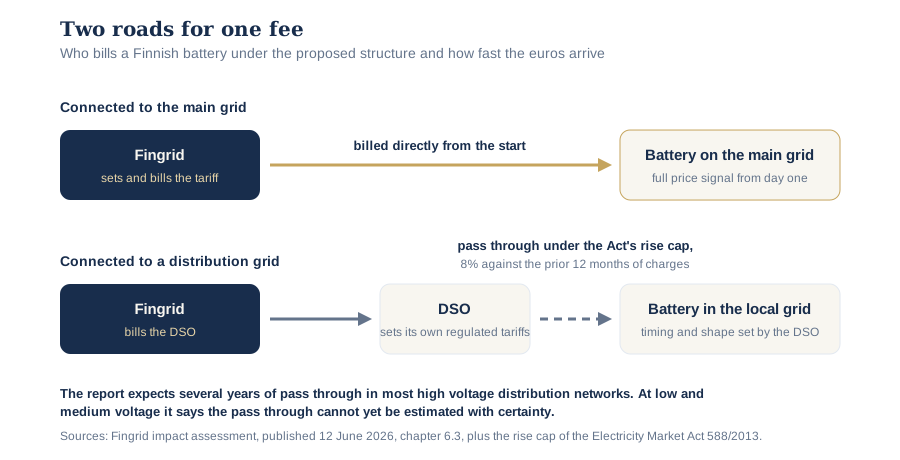
Where the bill lands depends on the wire. A battery on Fingrid's own grid would get the tariff directly. Storage connected lower down meets it through a distribution system operator (DSO), the company running the local grid, which pays Fingrid and recovers the cost in its own tariffs. That second road is slow: the Electricity Market Act caps rises in a customer's network charges at 8 per cent against the preceding 12 months, so the report expects several years of pass through to storage in most high voltage distribution networks. At low and medium voltage it says pass through cannot yet be estimated with certainty. The direction of the signal is universal; its speed is not, nor its shape below high voltage.
Developers sizing Finnish projects are the most exposed. On the 10 to 15 year revenue horizons we typically model, an asset financed this year would spend most of its life under whatever structure follows the year-end decision, so charge power caps, inverter sizing and the grid charging share stop being engineering footnotes. Operators see the same at dispatch: one aggressive charging hour reprices the month. Investors and lenders should ask which of the three charging scenarios sits in the base case they are shown. The fleet is no longer small: the report, citing Fingrid's open data, put storage above 1 MW across the transmission and distribution grids at 1,367 MW in May 2026, counting licensed facilities including some about to enter production. The main grid itself had just 50 MW connected through 2024, which is why the report models storage rather than measures it.
Aggregate fees fall 7 per cent for industry and 5 per cent for the group of DSOs and other consumption customers, with winners and losers inside both. On Fingrid's scenario (40 TWh more consumption by the early 2030s, 1 GW of storage per 10 TWh) storage would carry slightly over 20 per cent of the consumption capacity fee, easing everyone else's share.
What to do about it
- The consultation closes 14 August; the decision matters more. Calendar Fingrid's intended year-end call, because the structure, weightings and storage treatment can all still move.
- Re-run every Finnish revenue model with the three scenarios (full power, capped and hybrid) and report each fee saving net of the trading revenue it gives up. Carry the spread into the sensitivity table lenders see.
- Price an asymmetric configuration before financial close: full discharge rating with a charge cap enforced in the control software, against the symmetric default.
- Screen sites for hybrid connections; under this proposal co-location with generation is a tariff strategy.
- Map your connection level. A main grid asset prices the new structure from its start; a DSO connected asset faces a capped, slower pass through that is still undefined below high voltage. The difference belongs in the model, not a footnote.
Related insight
- The quiet collapse of Finland's balance fees, our August piece on the other Finnish fee line moving in the battery's favour.
- The double charging problem in European grid tariffs, our July piece on how France and Ireland price storage's grid use.
Where this lands in the model
Grid fees rarely decide a Nordic battery case on their own, but they are the quiet, structural line that separates a model that survives diligence from one that does not. This is the kind of question we at Auranova Ventures work through with developers and investors across the Nordics, Baltics and wider Europe: what a tariff consultation in Helsinki does to a sizing decision and a bankability case. If Finland is in your pipeline, reply and we will compare notes on how we are scenario-testing it.
What does your Finnish model charge itself for the grid in 2029? We read every reply.
Sources
- Fingrid, impact assessment report on the reform of the main grid tariff structure (12 June 2026): https://www.fingrid.fi/en/news/news/2026/impact-assessment-report-on-the-reform-of-the-main-grid-tariff-structure
- Fingrid, impact assessment of the main grid service fee reform, final report, English translation (Finnish original dated 26 May 2026, published 12 June 2026): https://www.fingrid.fi/globalassets/dokumentit/en/customers/grid-connection/impact-assessment-of-the-main-grid-service-fee-reform_final-report_english-translation.pdf
- Electricity Market Act 588/2013, section 26 a, the network charge rise cap: https://www.finlex.fi/fi/lainsaadanto/2013/588
- Fingrid, the main grid tariff structure reform, project and consultation page: https://www.fingrid.fi/en/grid/grid-connection-agreement-phases/main-grid-contract-and-service-fees/the-main-grid-tariff-structure-reform/
- Fingrid, main grid contract and service fees, 2026 price list: https://www.fingrid.fi/en/grid/grid-connection-agreement-phases/main-grid-contract-and-service-fees/
- Fingrid open data, total installed battery energy storage system capacity, dataset 424: https://data.fingrid.fi/en/datasets/424